Viz Roundup: Reimagining Sports Standings


Last month, former Iron Viz champ Ryan Sleeper asked the Tableau Public community to reimagine the way we visualize sports standings.
"As a lifelong sports fan and longtime data-visualization evangelist who has shared thoughts before on how a spreadsheet is not a data visualization, it pains me to analyze my team’s performance across every sport with nothing but a table of data," Ryan said.
Ryan wanted to do away with these dense tables of data. So he visualized the standings of Major League Soccer teams:

Then he asked you to tweet your sports-standings vizzes using the hashtag #standingsviz. Our Twitter feed was flooded with stellar vizzes that reimagined the way we look at sports standings. Here are just a few of them.
MLB
Shawn M. Levin showed how each MLB team progressed through the 2015 season. He grouped the teams into the six MLB divisions and added team logos. The result: The reader can quickly and easily see how the teams in each divison stack up.

MLS, Take 2
Steve Fenn took a different approach to visualizing MLS standings. His viz shows how teams are performing against the historical pace needed to reach league milestones.

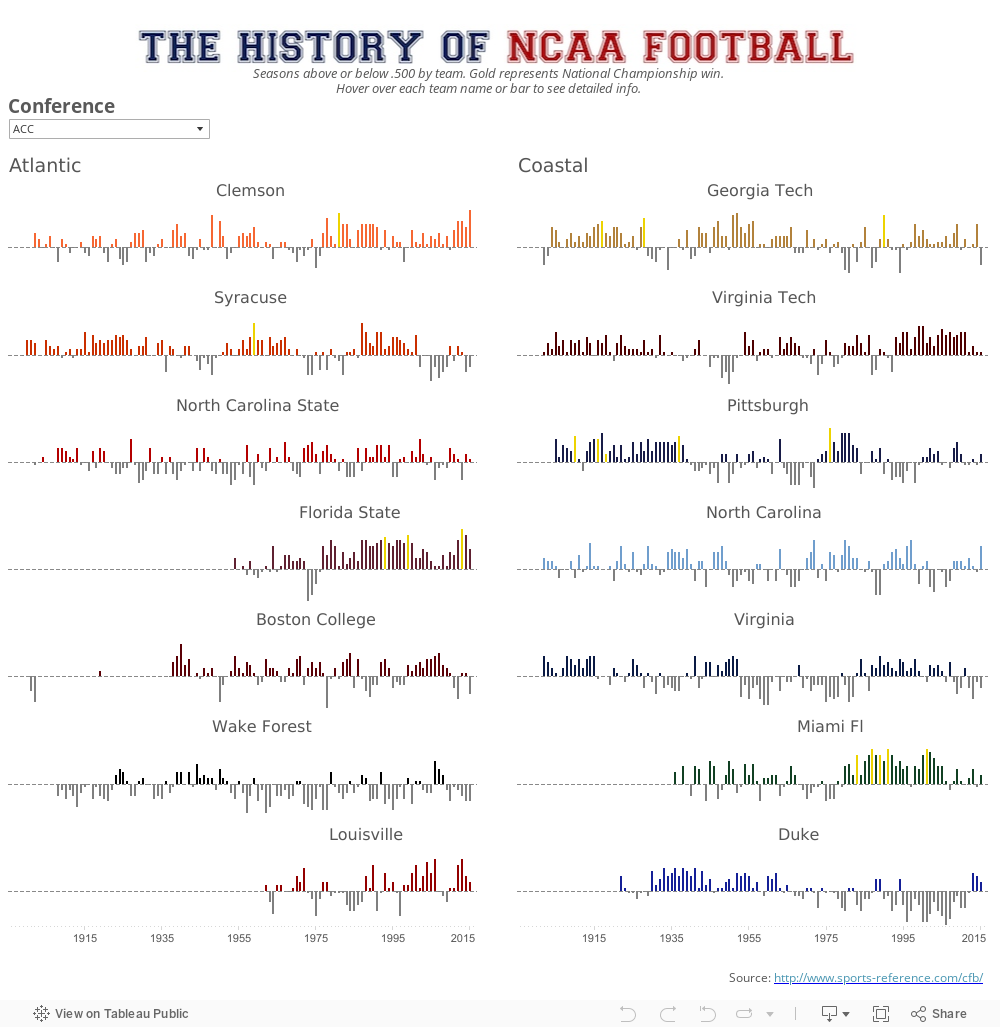
NCAA Football
Matt Chambers visualized the performance of all 128 NCAA football teams. Use the filter to choose a conference and explore the teams' performance. (And check out Matt's blog post on finding the small stories in this data set.)
Monaco Grand Prix
The Circuit of Monte Carlo, a "tight circuit with almost no overtaking opportunities is extremenly hard to master," according to John Magrini. John visualized the winningest drivers and cars in this prestigious race.

March Madness
Lindsey Poulter took a filter-based approach to visualizing March Madness standings. Select a school up top and a metric below to see how the school ranks.

English Premier League
Neil Richards completedly reimagined standings tables in this viz. Hover over each line to see how the team fared through the season and where it ended up.
"As each team travels around the circle, the closer it gets to the middle, the greater the danger of relegation," says Neil. "And of course, the team on the outside is the leader, with the overall champions (hint, they're in blue) reaching the finish on the far outside at the bottom of the circle."

Those are just some of the terrific vizzes by you, our community. For the entire collection, check out the #standingsviz hashtag on Twitter.
Zugehörige Storys

Meet Iron Viz 2024 Finalist Jessica Moon
 15 April, 2024

Meet Iron Viz 2024 Finalist Pata Gogová
8 April, 2024

Student to BI Analyst, How Tableau Can Lead to a Successful Data Career
 20 März, 2024
Blog abonnieren
Rufen Sie die neuesten Tableau-Updates in Ihrem Posteingang ab.