Recap: Another Fantastic Fanalytics at #Data16!


This post is featured as part of Community Month here on Tableau Public.
Fan·a·lyt·ics /fanəˈlidiks/
noun: The fun-filled final event at Tableau Conference featuring talks from sensational speakers and a good old-fashioned viz-off.
Fanalytics speakers never cease to impress and this year was no different. Three top Tableau Public authors took the stage to share their knowledge with attendees, and the presentations they delivered were nothing short of AWESOME.
First up was Pablo Saenz de Tejada whose premise was that Tableau Public is not only a great tool with which to learn about data viz. By applying and experimenting with your knowledge, he said, you can create resources from which others can learn.
Next Chloe Tseng shared how showing a mentor her entry for an Iron Viz feeder contest ended up pushing her toward a passion for visualizing data for social good. In a nutshell, her message was: Find. Source. Viz. Find a social cause and a corresponding data source. Then identify sources of the problem and find a solution. #VizForSocialGood
- Slides to come
Then Jacob Olsufka took us on a tour of baseball- and election-related vizzes. His three main points were:
- Be inspired. Figure out how to make your vision possible and build.
- Ask questions. Lots of questions.
- Think outside the (usual) chart.
- Slides to come
After the speakers dropped their mics, it was time for some vizzing action.
Usually we choose a pre-existing data set, but this year we threw a curveball and asked attendees to collaboratively create one. We asked them to answer a few questions about their age, gender, and where they hail from. We also asked about Tableau Public, the product they love oh so dearly: what new features they’d like to see, how we might improve social aspects, which chart type they most closely identify with, and so on.
Once everyone had submitted their answers, the race was on! Attendees broke off into groups and got to work. With only twenty minutes to create their dashboard and a shot at becoming the 2016 Fanalytics champions, they had to move fast.
The judges were blown away by all the resulting vizzes, but only three could emerge victorious.
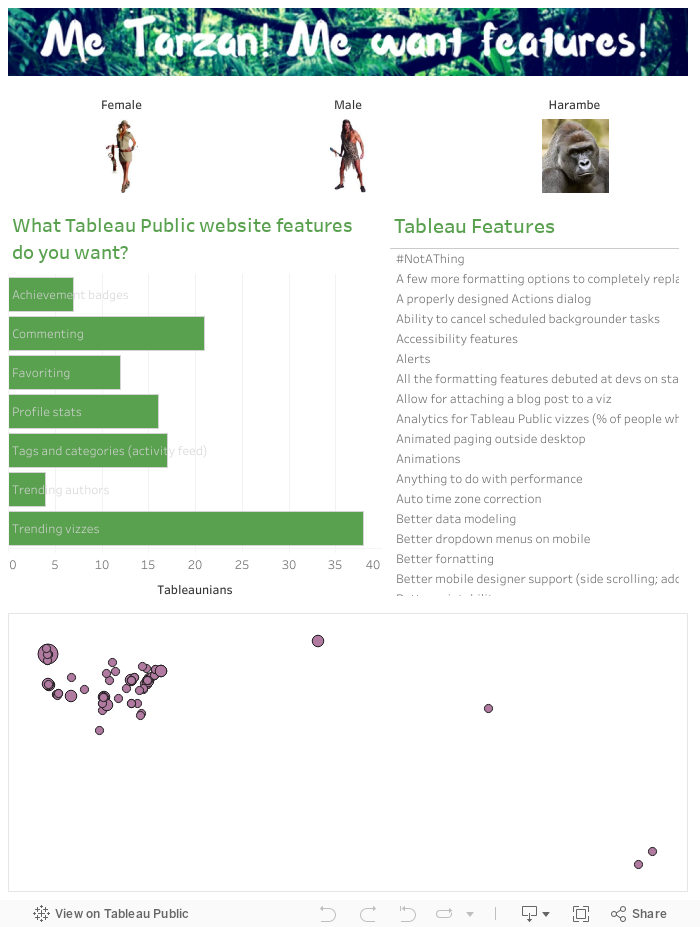
Swinging in at in third place were Jewel Loree, Peter Gilks and Chris Toomey. Their work, Me Tarzan Me Want Features, showcased the features desired most by the Tarzans, Janes, and Harambes in the room at Fanalytics as well as where they hail from.
For second place, the judges chose Tableau Tinder by Stephen Popick, Katherine Matthews, and Michael McGinnes. Using this cool tool, Fanalytics attendees could find their perfect match based on demographics and what kind of chart they identified with. I say swipe right on box and whisker plots!

Aaaaaaaand now, your 2016 Fanalytics champions are... **drumroll please**...
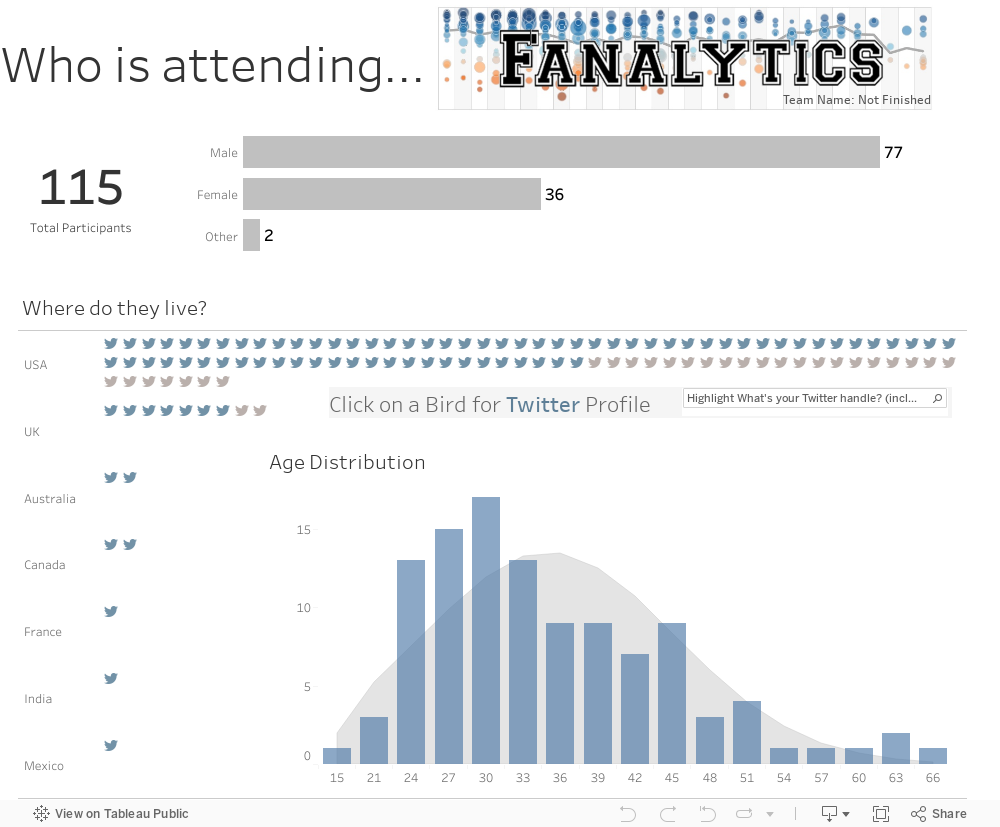
Adam Crahen, Josh Tapley, and Prashant Sharma! Their breathtaking dashboard showed who was in attendance at Fanalytics 2016 and where they live. Then to top it off, they pulled the urls for attendees' twitter profiles and linked out! NBD.
A HUGE thanks to everyone who participated! We can't wait to see what next year has in store!
For more conversations and takeaways from TC16, check out the hashtags #data16fanalytics and #data16 on Twitter.
Zugehörige Storys

Meet Iron Viz 2024 Finalist Jessica Moon
 15 April, 2024

Meet Iron Viz 2024 Finalist Pata Gogová
8 April, 2024

Student to BI Analyst, How Tableau Can Lead to a Successful Data Career
 20 März, 2024
Blog abonnieren
Rufen Sie die neuesten Tableau-Updates in Ihrem Posteingang ab.