Vizzes from Around the World: Welcome to Brazil!


Bem vindo ao Brasil! After our Italy's Got Talent blog post, we asked you which of the following countries you'd like to see covered in our next Vizzes from Around the World installment. It was almost a tie, but in the end, Brazil came out ahead!
Which country should we feature in our next 'Viz from Around the World' blog post?
— Tableau Public (@tableaupublic) June 16, 2017
You may be aware that Alberto Cairo was once the director for Infographics and Multimedia at Época - Editora Globo in Brazil. After spending a couple of years in the country, he shared his insight into Brazilian dataviz for Andy Kirk's 'Visualizing Data' blog. That was six years ago, and his conclusion back then was that "Brazil's graphics and visualizations are flourishing". So what's new under the sun?
A Dynamic Data Journalism Scene
Newspapers like Folha de São Paulo, Estado de São Paulo, and O Globo have been producing data journalism pieces and award-winning visualizations for over five years now. Strenghtening its take on data visualization, Folha recently created a dedicated data team, gathering journalists from across the newsroom with a common passion for data. Among them is the famous visual journalist Simon Ducroquet, who created this piece on the shortage of children's daycare.
Next to these established players, some new online outlets are entering the playground. Nexo is one of those new players, building interesting data pieces like this article on wealth distribution in a selection of countries, or an innovative exploration of the rhythm in Brazilian literature by Rodolfo Almeida and Daniel Mariani dissected in Storybench.
Another young project worth following is the Gênero e Número (Gender and Number) website, which just celebrated its first year of existence. It takes a data approach to gender inequality issues, like in this recent piece on female authors at the national FLIP Literary Festival.
Data Literacy on the Rise
The Brazilian Chapter of School of Data, Escola de Dados, is organizing courses in newsrooms, universities, and NGOs and offering MOOCs in order to equip journalists and researchers with data skills. Seeing the increasing interest for data-related training, they created the data journalism conference CODA-BR in 2016. Following the success of the first edition, which welcomed 24 speakers and 140 participants, the second edition of CODA-BR will take place on November 25-26 in São Paulo.
The state of open data is also feeding this movement towards data literacy. Platforms such as the official Brazilian Open Data Portal and Data Viva make it easier to find national and regional data. Meanwhile, organizations such as Open Knowledge Brazil and Gastos Abiertos promote transparency as a way to improve the relationship between the government and civil society.
Passionate Tableau Public Authors

Isabella Mayer de Moura: the Independent Journalist
Isabella Mayer de Moura created hew own news website, Conecdados after finishing her data journalism studies. She's based in Curitiba and reports on a variety on topics ranging from local politics to economics and sociological issues.


Daniel Lima: the Forerunner
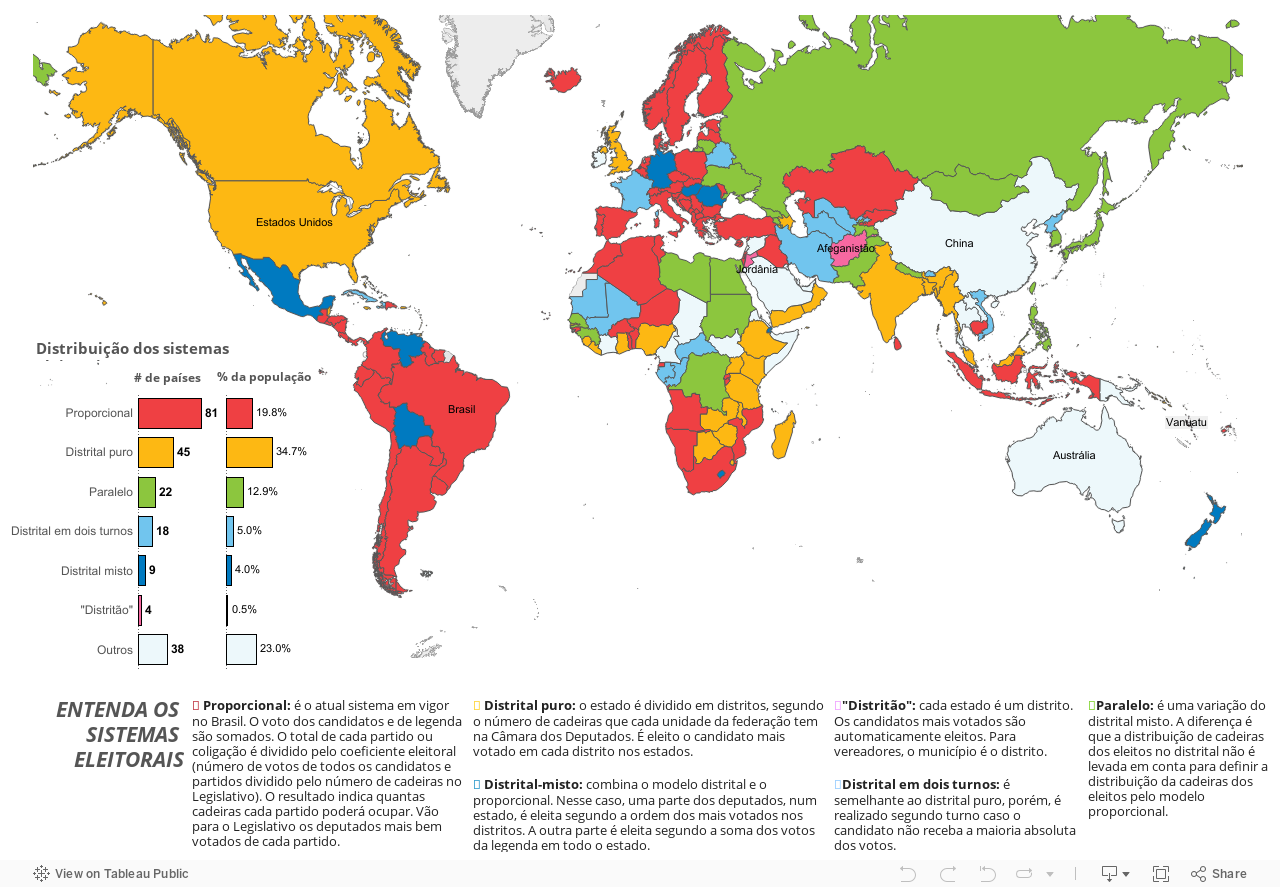
Data journalist and assistant-editor at O Globo, Daniel Lima has been using Tableau Public since 2013. Over the years, he's created some iconic pieces for O Globo, such as this map of electoral systems worldwide.

André Monteiro: the Data Reporter
André Monteiro used to work at Folha de São Paulo as a data reporter. During his time at Folha, he created impactful visualizations on a number of topics including education, public transportation and health, including the map below on the dengue epidemic.


Tiago Cepas Lobo: the Health Researcher
Tiago Cepas Lobo is a junior researcher at Abrale/Abrasta and TJCC, research organizations specializing respectively on blood diseases and cancers. For more health-related visualizations from Brazil, you can also check Hellen Matarazzo's profile.


Gustavo Gaudarde: the Energy Specialist
Gustavo Gaudarde is a reporter at the Brazil Oil & Gas Energy Review, and has been analyzing the ups and downs of the Oil & Gas industry for the last three years. Explore his profile for clean charts and maps with a strong visual identity.


Rachel Costa: the Expatriate
Rachel Costa is a journalist turned into information designer. Brazilian, she's currently exploring the world of dataviz at the Data School in London. She vizzes in both English and Portuguese.

We hope you've enjoyed this short trip to Curitiba, Rio de Janeiro and São Paulo! After Europe and Latin America, we'll take you to Asia next time. So stay tuned!
Zugehörige Storys

Meet Iron Viz 2024 Finalist Jessica Moon
 15 April, 2024

Meet Iron Viz 2024 Finalist Pata Gogová
8 April, 2024

Student to BI Analyst, How Tableau Can Lead to a Successful Data Career
 20 März, 2024
Blog abonnieren
Rufen Sie die neuesten Tableau-Updates in Ihrem Posteingang ab.