Election Viz Gallery: Exploring the Data Stories Behind the Races


Note: This piece is part of Election Month here on Tableau Public.
You've heard from the candidates—but what does the data say? We're curating a gallery of vizzes to find out!
Join us as we explore the data stories about all things US elections. See how the presidential candidates stack up, how the country's political divide has changed over the years, and how past presidents fared in approval ratings. Check out our gallery, which includes a number of vizzes by you, our community. And do check back as we'll continue to update the gallery through Election Day.
Here are a few highlights to get you started.
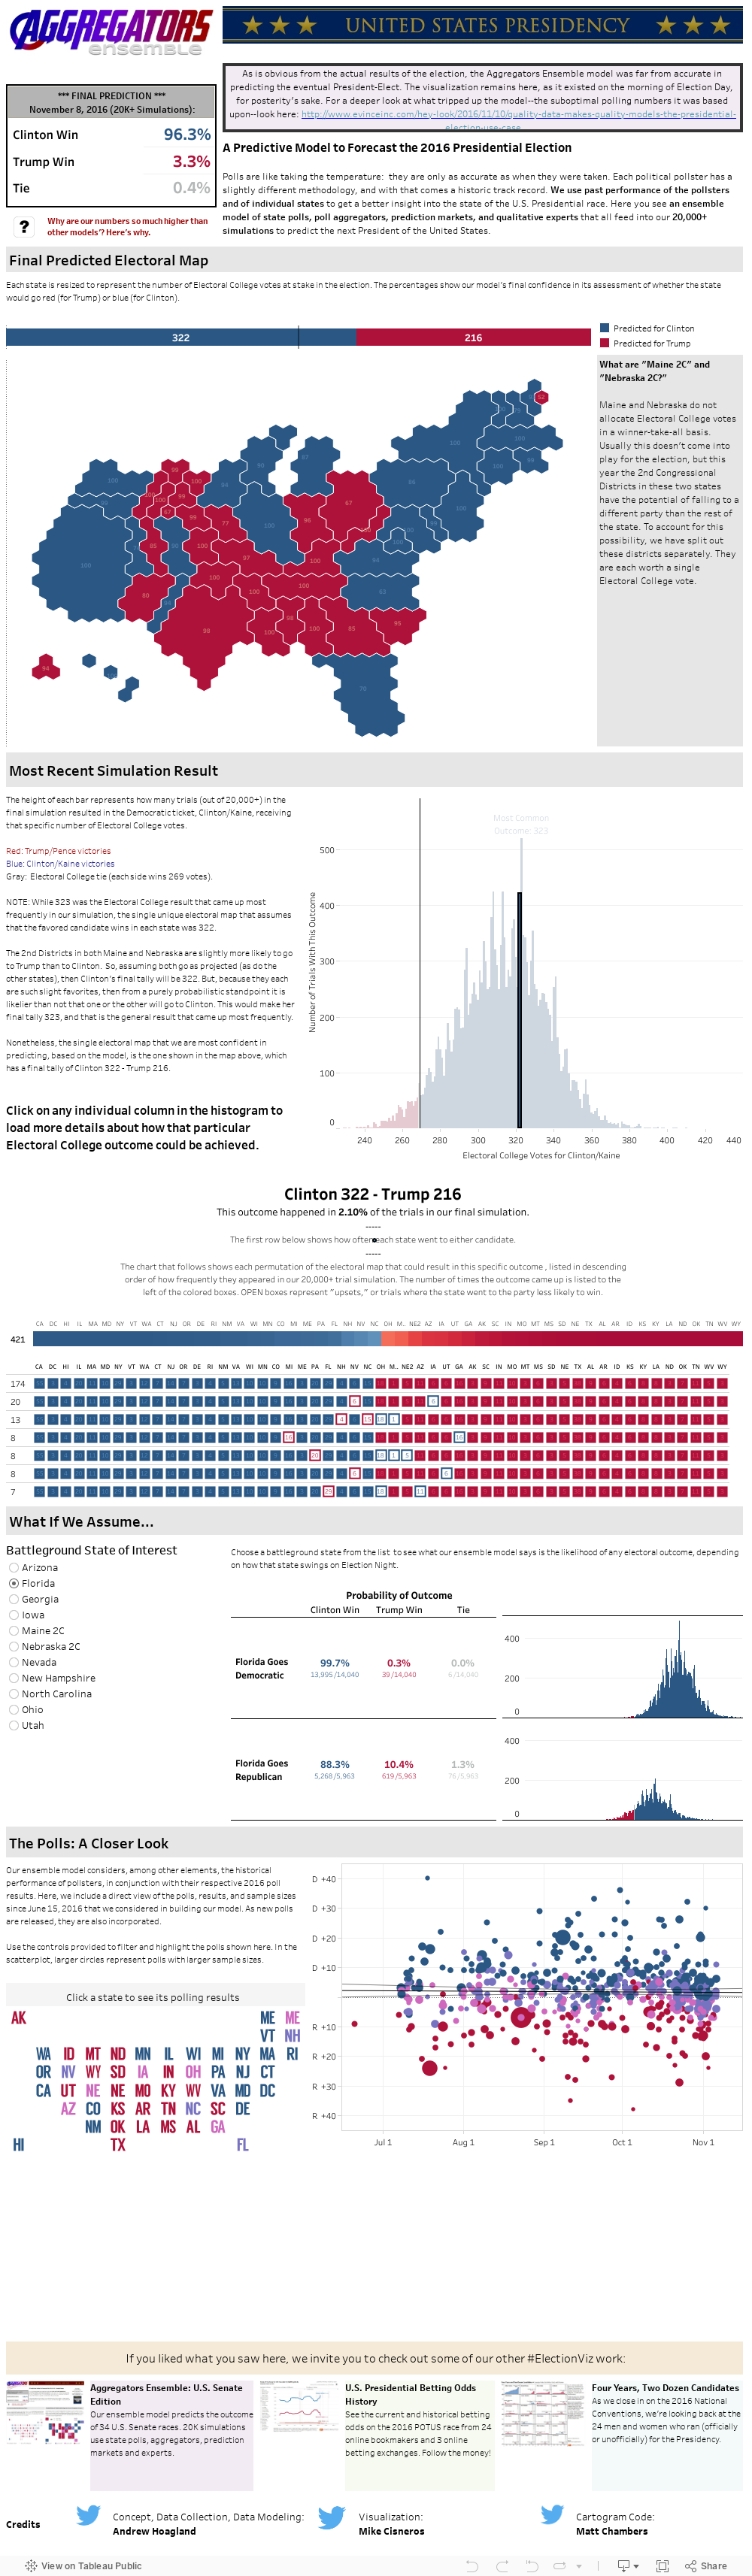
Prediction Model: How Battleground States Are Likely to Vote
How will battleground states swing come Election Day? Andrew Hoagland and Mike Cisneros looked back at past performances of pollsters to create this prediction model based on more than 5,000 simulations. Check out the cartogram on the left, which shows states sized to reflect the number of electoral votes at stake. According to this model, Colorado has a 72% of going Democrat while Ohio has a 60% chance of voting Republican.
The Growing Political Divide
In recent years, the political divide between Democrats and Republicans has doubled, as this viz by Robert Rouse shows. Robert visualized the Pew Research Center's survey data, which shows that members of both parties have moved away from center in recent years. Click on #2 to compute your own ideological score and see how you stack up against the survey respondents.

Past Presidents' Approval Ratings
When the going gets tough, presidential approval ratings drop, says Dustin Cabral. "Most presidents start with high approval ratings; however, the majority drop significantly by the time they leave office," he says.
The data shows this downward pattern for almost every president since 1941 (Bill Clinton is the lone exception). But while some presidents' ratings bounce back up over time, others never recover from their initial decline. Check out Harry S. Truman, who started with the highest approval rating on the chart (91%), then dipped to the lowest (22%).

Got an election viz of your own? Tweet it to us using #ElectionViz!
Related stories

Meet Iron Viz 2024 Finalist Jessica Moon
 15 April, 2024

Meet Iron Viz 2024 Finalist Pata Gogová
8 April, 2024

Student to BI Analyst, How Tableau Can Lead to a Successful Data Career
 20 March, 2024
Subscribe to our blog
Get the latest Tableau updates in your inbox.