Step and jump into Tableau Public 2018.1


Tableau Public 2018.1 is here to make your analysis easier! What’s new in 2018.1? Create step and jump lines with just one click. Build multi-layered maps to visualize and analyze your spatial data with ease.
Here's a full list of features:
- Step and jump lines
- Dual-axis mapping improvement
- Improved hierarchy filtering
- Viz in Tooltip improvement
- Additional clustering functionality
- Analytical object guidance
Let's take a closer look at a few of these.
Step and jump lines
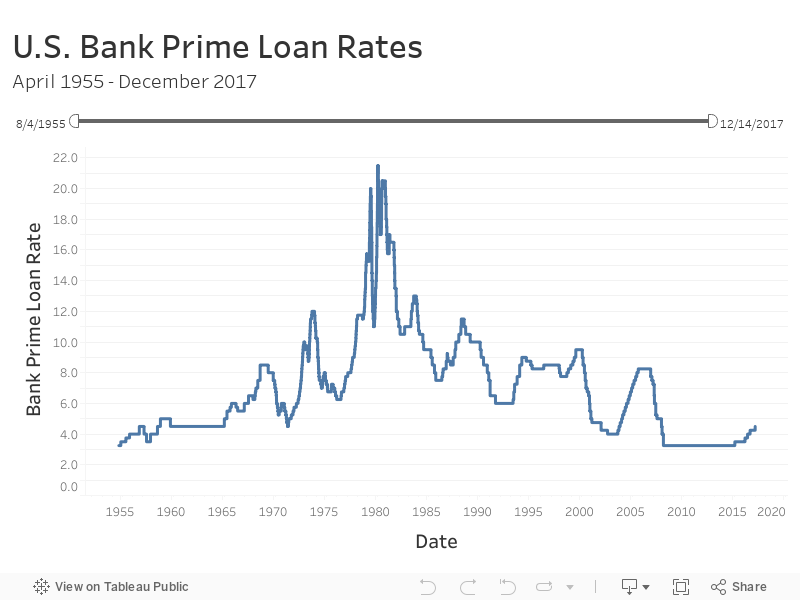
Straight lines portray a constant rate of change between two data points, but it’s not always obvious how long the value at a specific point lasts or how big the change is between the points. To get the real story from your discrete data, you can now use step and jump lines to accurately show durations of values and magnitudes of change. This is helpful for data that doesn't change at a continuous pace, like account balance data, inventory level data, interest rates, and more.
Tableau Public authors have been creating step and jump lines in the past, and you may have experimented building them with the help of blog posts by Tim Ngwena, Chris DeMartini, Rody Zakovich, and perhaps others. Now you can apply these line types with a single click!

In the example below, I chose to visualize the noncontinuous change in U.S. Bank Prime Loan Rates over time (data found here). Feel free to download the viz and explore!
Dual-axis mapping
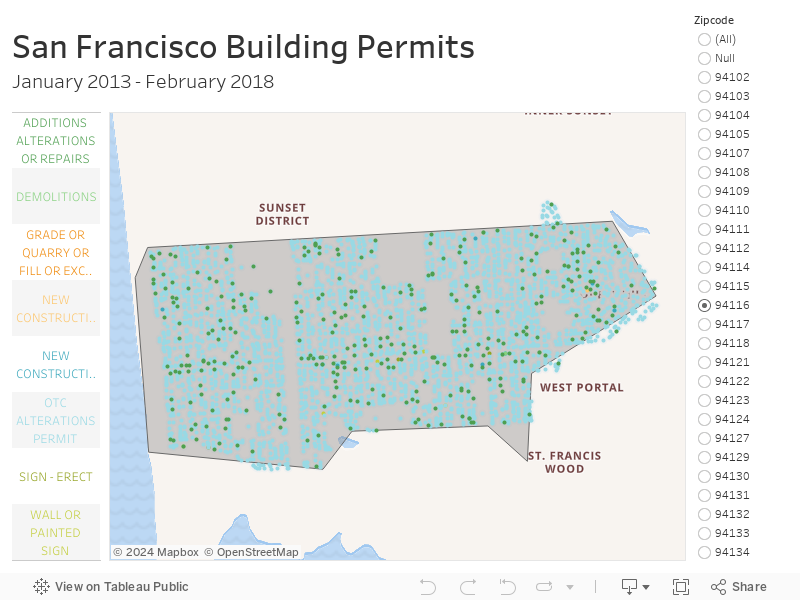
You can now integrate fields from built-in geographic roles with custom latitude/longitude points. You can also join together tables in disparate data sources and overlay geographic point data on top of shapefile data using dual-axis maps. In the example below I’m using San Francisco building permit data. Follow along to see how it works!
- Double click the Zipcode field to create a map, and then duplicate the map by copying the Latitude (generated) pill.

- Change the type of one of the marks to Map. For the other marks card, remove Zipcode and drag and drop your custom latitude and longitude onto Detail.

- Now you can show custom lat long and a built-in geographic field in the same viz. You can use dual axis to overlay the marks on top of each other.

Feel free to download the viz and explore!
Experience the newly expanded Tableau platform
In addition to all of the features in our 2018.1 release, we have exciting new developments as we continue to lower the barrier to analytics for everyone: a new self-service data prep product and new subscription offerings.
Tableau Prep
Whether you’re cleaning, shaping, or combining data from different sources, data prep can be a repetitive, manual, and time-consuming process. Our brand new product, Tableau Prep offers a direct and visual experience to make data prep simple. There’s currently no Public version, but you can learn more about Tableau Prep and where to get it.
Subscription offerings
Tableau empowers everyone from the individual analyst to information workers in large organizations to see and understand data. Tableau's new subscription offerings match the appropriate capabilities with the unique needs of different types of users to create, explore, and view trusted content with Tableau’s governed self-service analytics platform. If you have a need to provide capabilities tailored to users at your organization, learn more about Creator, Explorer, and Viewer.
We hope you love Tableau Public 2018.1 as much as we do, and we're looking forward to seeing what you create!
The Tableau Public Team
Related Stories

Meet Iron Viz 2024 Finalist Jessica Moon
 April 15, 2024

Meet Iron Viz 2024 Finalist Pata Gogová
April 8, 2024

Student to BI Analyst, How Tableau Can Lead to a Successful Data Career
 March 20, 2024
Subscribe to our blog
Get the latest Tableau updates in your inbox.