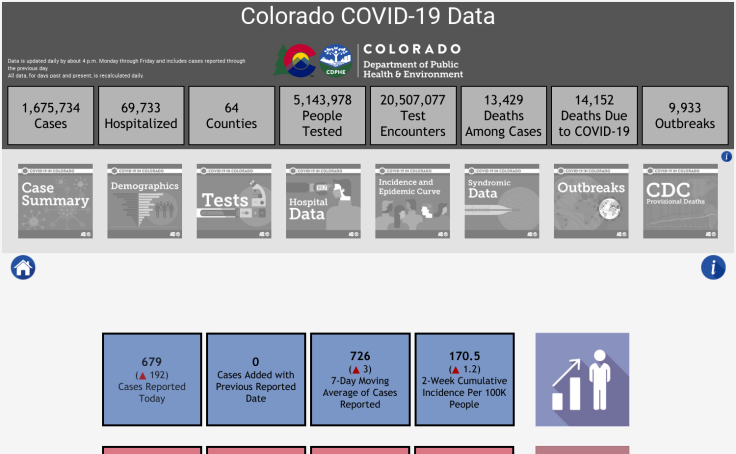
Coronavirus (COVID-19) Viz Gallery


See how people are using data to navigate the pandemic

There are thousands of vizzes about Coronavirus published to Tableau Public, with more added every day. With the help of health and data visualization experts,
we’ve curated a gallery of some of the most impactful dashboards created by governments, businesses, nonprofits, and data-savvy citizens.

Explore More Data Resources


Government


See how governments and citizens alike are creating resources to help their communities

understand the spread and impact of COVID-19. View the government data track to learn more.


North Carolina

NC Department of Health and Human Services

South Dakota Cases

Benchmark Data Labs

US Unemployment Claims and Rates

Recovery Decision Science

Ohio Cases

Ohio Department of Health

Connecticut Cases

CT Data Collaborative

Oregon Cases and Testing

Oregon Health Authority

Seattle-Area Emergency Food Resources

City of Seattle Human Services

California Cases Dashboard

California Health and Human Services Agency

Gyeonggi, Korea Cases

Gyeonggi Infectious Disease Control Center

Colorado COVID-19 Data

Department of Public Health and Environment

Virginia COVID-19 ZIP Code Dashboard

Virginia Department of Health


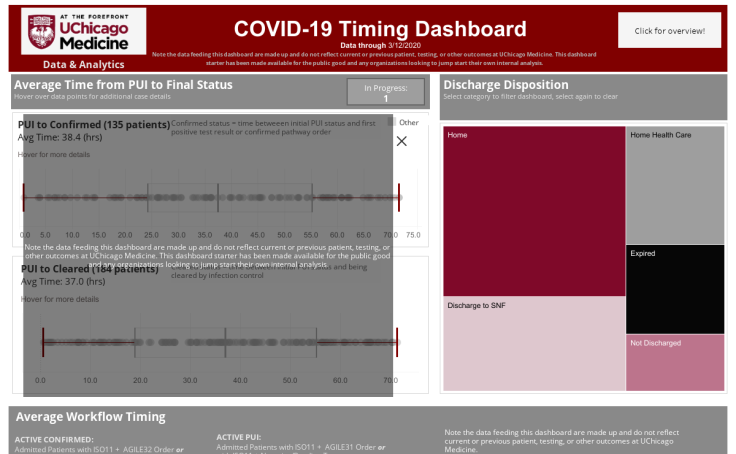
Healthcare & Public Health


Explore visualizations from the healthcare community that help track the spread

of COVID-19 and its effects on public health. View the healthcare data track to learn more.


Economy & Business


See visualizations that showcase the impact of COVID-19 on global, national,

and local economies and industries. View the economy data track to learn more.