#Oktoberfest2015: Location-Based Social Media Monitoring at the Munich Beer Festival


Besides Tableau Conference 2015 in Las Vegas, the other big event that happened in October was…Oktoberfest in Munich. (But did you know it starts in September, so that visitors can enjoy a few more days of good weather?) For our blog series in November – Social Data Month – Heinz Schultz of RADiOSPHERE wrote this guest post about visualizing social media data from the Oktoberfest.
Klicken Sie hier für die deutsche Version des Textes.
After the final tattoo – the traditional ceremony at closing hour – of the 185th Oktoberfest, the tally stands at 5.9 million visitors from all over the world. Visitors also set a record for social media postings at the fairground this year: more than 3 million mentions, photos, comments, likes and retweets have been shared via Twitter, Instaram, Facebok, VK, Sina Weibo, Flickr, Youtube, Picasa and many other popular channels. That is a flood of information that can be analyzed and visualized.
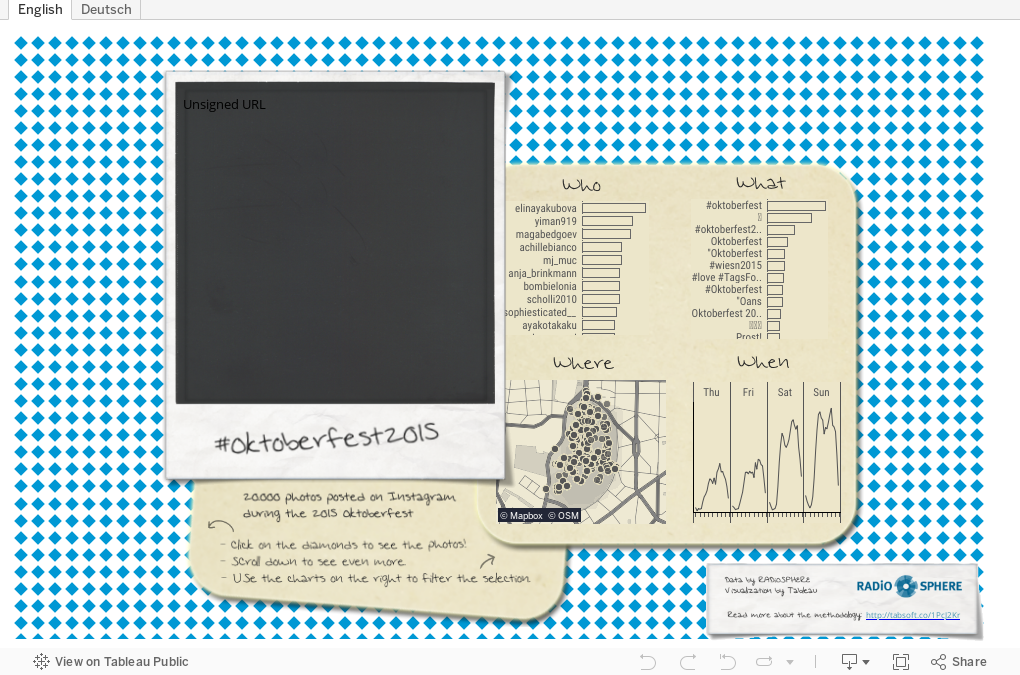
In this Tableau Public viz we show a snapshot of this data: almost 22,000 photos shared on Instagram, the popular platform for uploading selfies and other photos. Besides the exact location from where on the fairground the photo was posted, the viz also looks at the user names, hashtags used, and the timestamp of the posts.
The data behind the viz was captured using a tool called GeoVoxx. (See screenshot below.) This enables an accurate analysis of social-media posts that have been uploaded from the Oktoberfest fairground during the time of the event. With GeoVoxx one can draw so-called geofences on a satellite map. In this manner, post that were send from a device with enabled geotagging and that were shared publicly can be analyzed, exported, and further processed in a other tools, such as Tableau.
 Geofence around the Oktoberfest fairground – ©GeoVoxx
Autres sujets pertinents

Meet Iron Viz 2024 Finalist Jessica Moon
 15 avril, 2024

Meet Iron Viz 2024 Finalist Pata Gogová
8 avril, 2024

Student to BI Analyst, How Tableau Can Lead to a Successful Data Career
 20 mars, 2024
Abonnez-vous à notre blog
Recevez toute l'actualité de Tableau.