How to Map US Congressional Districts Using Tableau


This post is featured as part of Election Month here on Tableau Public.
Have you ever had occasion to use custom polygons in Tableau? Or maybe you’ve wanted to, but didn’t have the time to learn?
Well, have I got an opportunity for you!
I’m going to share a shortcut to creating a Tableau viz for this year’s election. And it will let you try out custom polygons without having to do any heavy-lifting. Why? Read on!
Congressional Redistricting
The courts ordered three states—North Carolina, Virginia, and Florida—to redistrict for the 2016 election. This is different from the Census-based redistricting process, where all of the states’ congressional allocations are redistributed.
In November, we will elect members of the 115th Congress, which will be seated in early January. This means that in the three states under redistricting orders, candidates are campaigning in districts that will not officially exist until January.
How does this affect Tableau? Congressional districts have been included in our tool since Tableau 8.2. However, Tableau 10 includes the current 114th congressional districts, not the future 115th congressional districts.
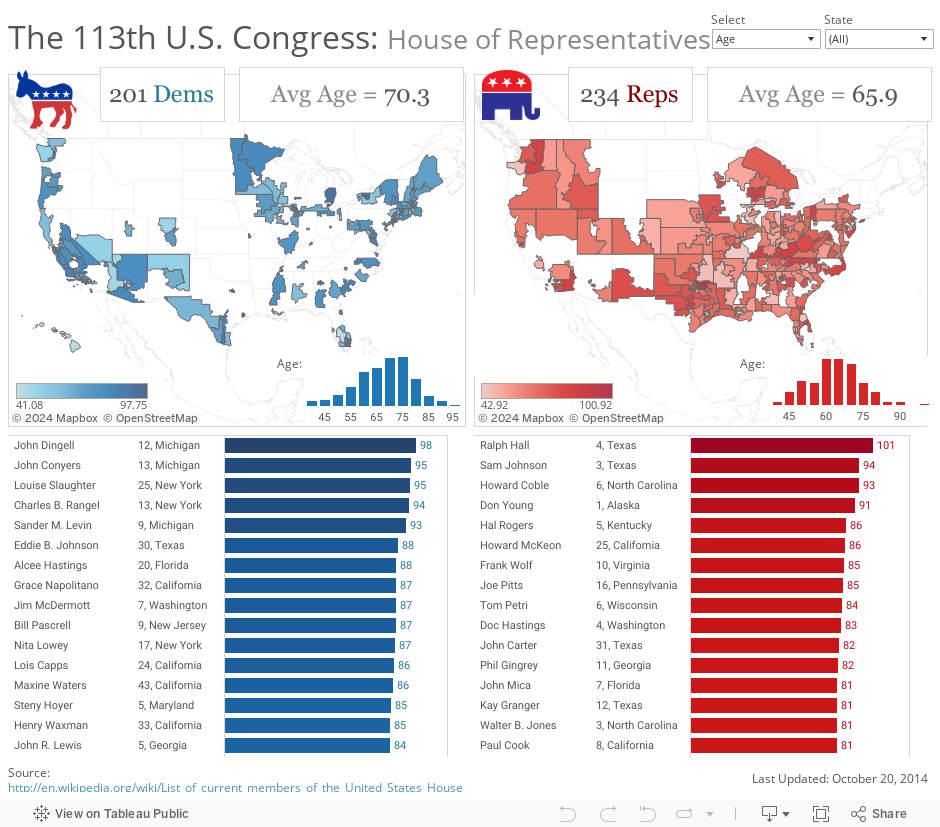
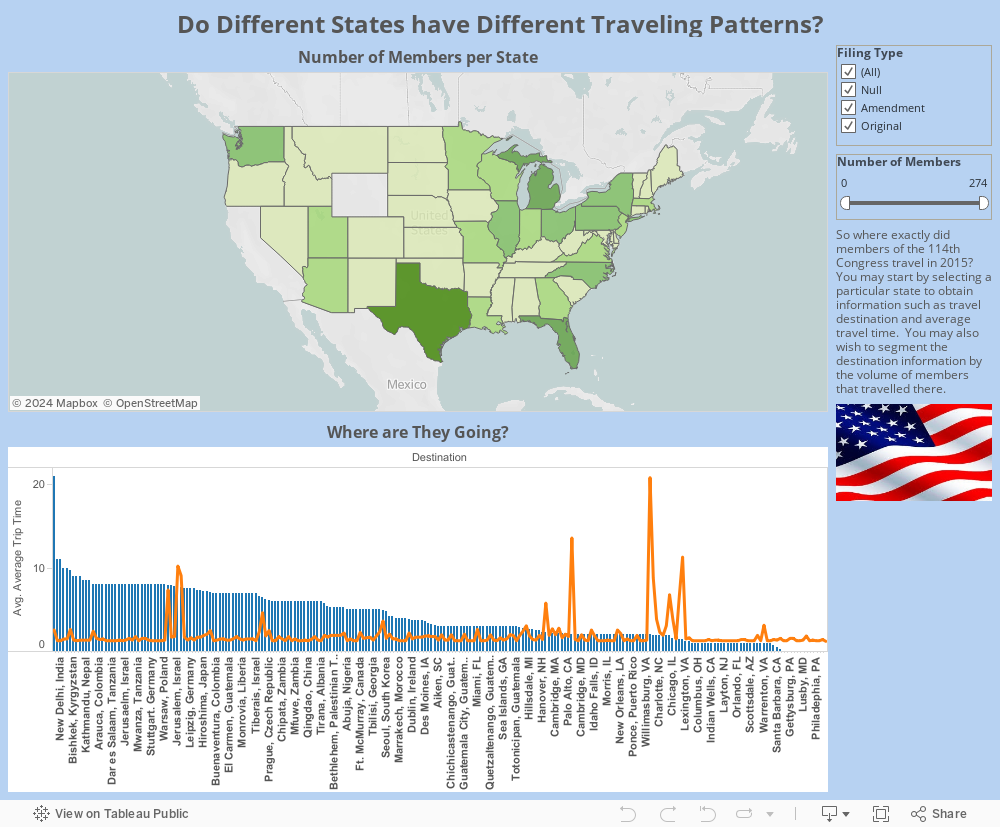
Want to see some examples? Here are some vizzes that have used the built-in congressional district shapes:
Custom Polygons: What Are They?
Now that you’ve seen what’s possible with the built-in districts, I’m sure you want to know more about these custom polygons I’ve mentioned. Custom polygons are a series of latitude and longitude points. They contain information that tell Tableau how to connect those points to create the shape you need.
There’s a fantastic overview starting at 1:53 in this video:
How I Created My Viz
I know, I know—you’re here because you don’t want to have to learn everything from the ground up. Let’s see the good stuff!
Now that you have an idea of what you need to create custom polygon maps, let me give you some shortcuts for the 2016 election.
Here’s a simple viz I created for the 2016 election. This includes the 115th congressional districts.
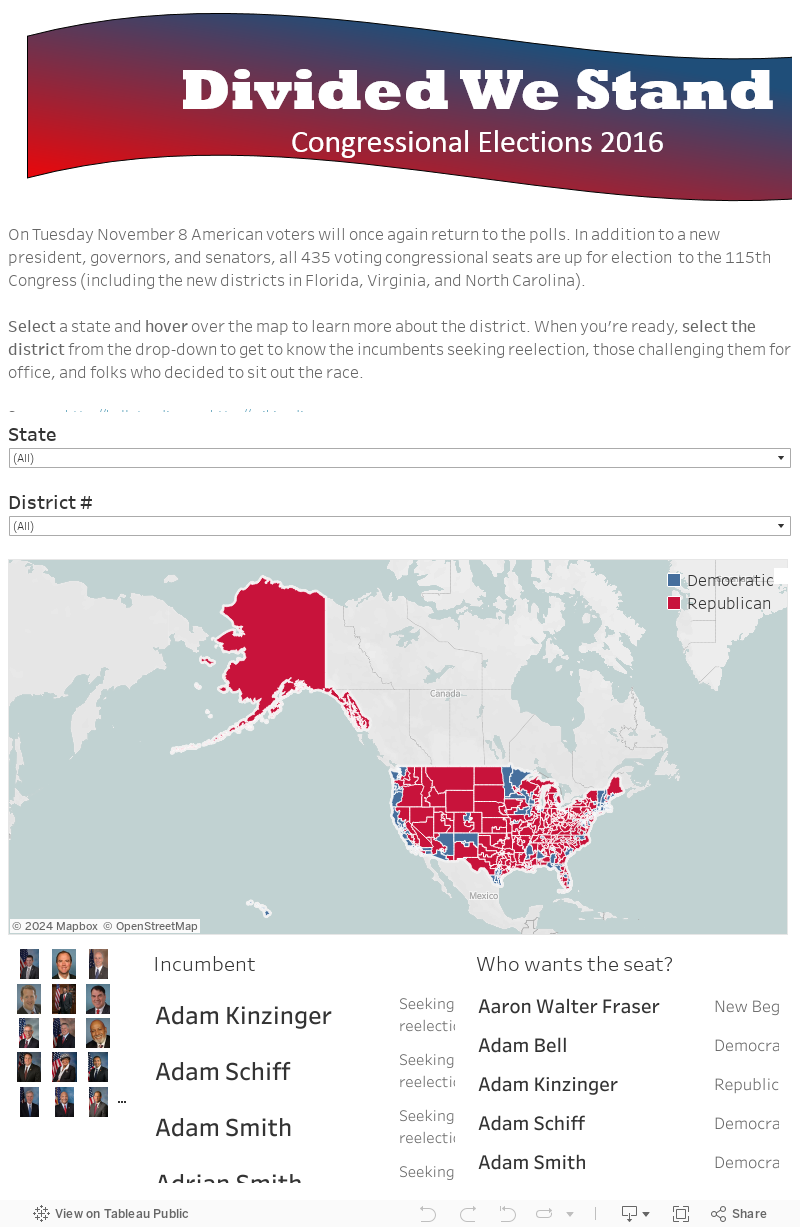
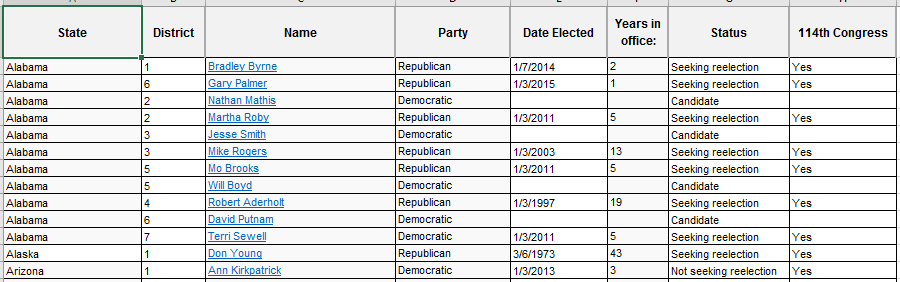
In this viz, I used custom polygons for all 435 congressional seats. The data source looks like this:
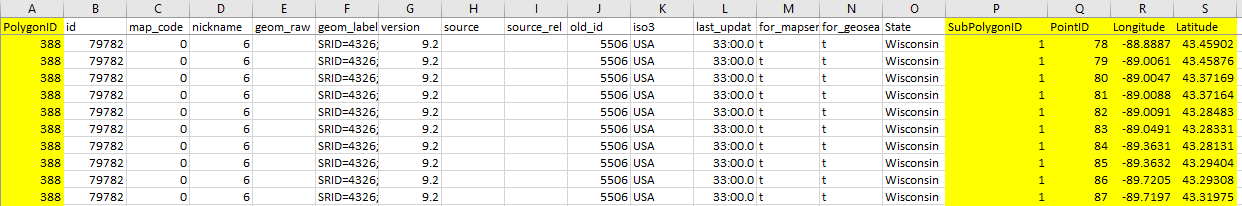
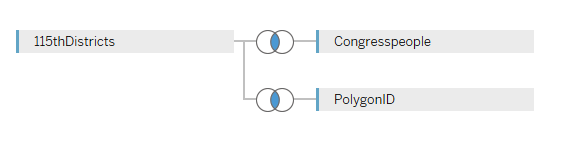
There are five important columns here: Latitude, Longitude, Polygon ID, SubpolygonID, and Point ID. All of these are used to draw the shapes in Tableau. I called this tab 115thDistricts.
Because the district number wasn’t attached to the polygons, I also created a table mapping the Polygon ID to the State and District. I called this tab PolygonID.

And finally, for color and other details, I created yet another table mapping the State and District to details such as the current congressperson, his/her party, and time in office. I called this tab Congresspeople.
I joined the three sources using an inner join:
Once the data set was loaded, it was a pretty simple process from there.
- Create a new chart
- Double-click on latitude and longitude (not the generated versions)
- Change the chart type to polygon
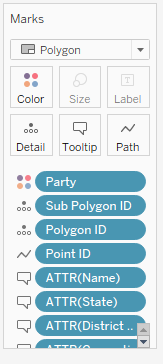
- Drag PolygonID to the Detail card
- Drag the SubpolygonID to the Detail card
- Drag PointID to the Path card
This should get you a basic filled map, using all of the custom polygons for the congressional districts. What you do with it from here is really up to you. But in case you want to know what else I did, here are the steps:
- Filtered so only the incumbent data was showing. (I had a column differentiating the incumbents from the challengers)
- Dragged the party to the Color card. (Because this is filtered, it will only render the party for the current incumbent in each district)
When I finished with my map, here’s what my Marks card looked like:
The Goods
Now that you have a sense of how to use custom polygons (without ever learning how to generate the latitude, longitude, pointID, polygonID, and subpolygonID!), you can use the files I created for my viz in order to create your own. You can download the Excel file with congressional district shapes, incumbents, and challengers here.
I also recorded a training that shows this process step by step, and it covers more than just the map! Take a peek for custom-shape files, which I used to show pictures of all 435 congresspeople.
Head over to our training page for all of our election-themed tutorials. Check out our #ElectionViz gallery for inspiration, and tweet us yours @tableaupublic using the hashtag!
Learn more about polygon maps:
- Video: Polygon Maps
- KB Article: Creating Polygon-Shaded Maps
- Online Help: Create Tableau Maps from Shapefiles
- Blog Post: US Congressional Chloropleths Made Easy
- Tableau Community Post: Step By Step Instructions – ShapeFile to Custom Polygons using Open Source GIS (QGIS)
Learn how to use custom shapes for congressional photos:
See what others are doing with custom polygons:
Autres sujets pertinents

Meet Iron Viz 2024 Finalist Jessica Moon
 15 avril, 2024

Meet Iron Viz 2024 Finalist Pata Gogová
8 avril, 2024

Student to BI Analyst, How Tableau Can Lead to a Successful Data Career
 20 mars, 2024
Abonnez-vous à notre blog
Recevez toute l'actualité de Tableau.