The Need for Speed Upfront: Analyzing the Tactical Patterns of Euro 2016


This is a guest post by Institut für Spielanalyse in Potsdam (the Potsdam-based Institute for Game Analysis). For Spiegel Online, a team of sport scientists examined all 51 UEFA Euro 2016 games using innovative statistical methods (examples available here). This is an exclusive summary of the tournament for the Tableau Public blog.
Klicken sie hier um den text auf Deutsch zu lesen.
UEFA Euro 2016 was shaped by defensive lines. But in the end, what people talk about most was the offfense. The Potsdam Institute for Game Analysis has analyzed and interpreted the tournament with this in mind. We've focused on three elements which influence the offensive game: the role of chance, the situation in the game at a specific moment, and tactical direction. One example: Éder's goal, which decided the final, fits two patterns of successful situations in the tournament: high speed after gaining the ball and element of chance involved in the play leading to the goal.
1. The Influence of Chance
A total of 108 goals were scored at UEFA Euro 2016: 69 in the group stage, 39 in the elimination stage. Of these, 77 (71.3%) were scored without an element of chance, and 31 (28.7%) with at least one element.
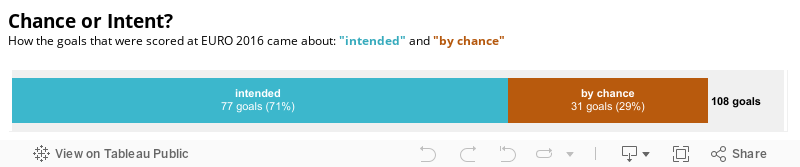
The following five characteristics define chance, because they can't be controlled by the attacking team. More than one of these may occur together when a goal is scored:
- A shot on goal being deflected
- A ball hitting the goal post bouncing back to the striker in an uncontrollable manner or being sent into the goal
- The ball going into the goal despite being directly touched by the goal keeper
- The defensive line involuntarily supporting the action by losing the ball shortly prior to the goal or scoring an own goal
- The goal being scored by a shot from a distance of more than 25 meters (75 feet) with abetting circumstances, such as the obstructed vision of the goal keeper, a bounce shot or a swerving ball
The second characteristic was the most common. This means that 12 goals occurred immediately after the ball was passed from a defender to an opposing player or an own goal was scored.
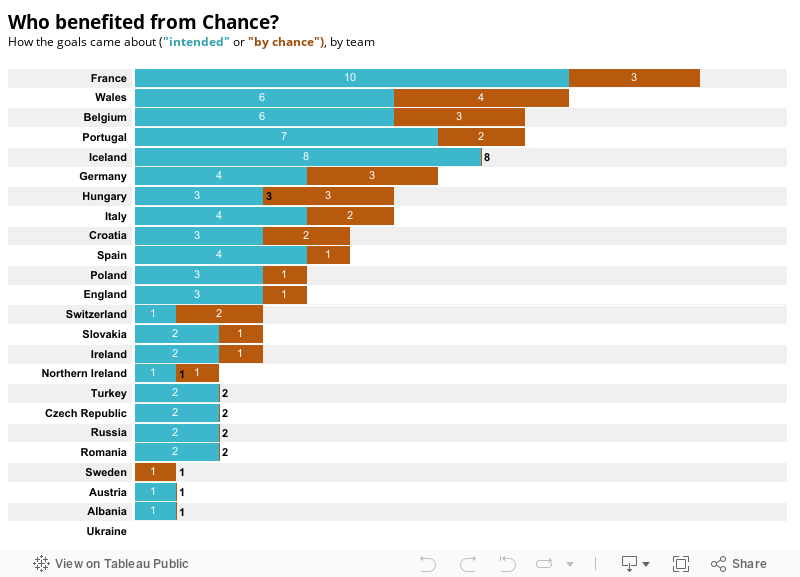
The goals scored by chance were not distributed evenly among the teams. The German team, for example, was aided by chance in three of its seven goals. The findings for the Icelandic squad are particularly impressive: none of the team's eight goals present any of the characteristics of chance. (However, this is influenced by the fact that the characteristics of chance do not include the English goalie's reactions.) With a total of four, underdog Wales was the team with the highest number of goals which were influenced by at least one of the characteristics.
Overall, this tournament has been shaped by chance considerably less than the previous two tournaments. The Euro 2012 and the 2014 World Cup saw a total of 40% of goals aided by chance. This time it was only about 30%. Moreover, the findings support the trend of decline observed since 2004 (48%).
2. How Goals Were Scored
Goals scored can be categorized based on the situation in which they came about:
- Following set pieces
- While on attack: The team on defense acts in an orderly manner and in formation
- Through a quick transition game , i. e. situations in which the scoring team gains the ball and, playing at high speed, takes advantage of the space between defensive players while they are out of formation
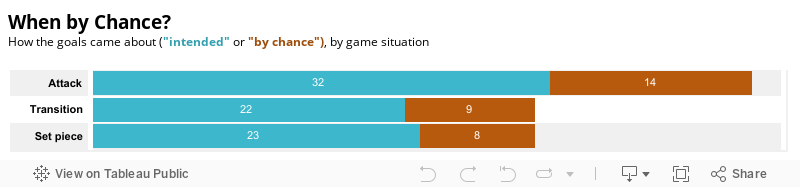
This overview shows:
- 31 goals (28.7%) were scored after set pieces, eight (26%) of which involved chance
- 446 goals (42.6%) were scored while the team is on attack, 14 (30%) of which involved chance
- 31 goals (28.7%) were scored after fast transition plays, nine (30%) of which involved chance
If the results were taken in isolation, a possible interpretation would be that the players have evolved in technique and tactics, so chance only plays a part in less than a third of cases.
However, fewer goals were scored per game in comparison with the last two tournaments. While Euro 2012 saw 2.45 goals per game and the World Cup in Brazil saw 2.7 goals per game, at UEFAEuro 2016 only 2.12 goals per game were recorded. Though there is no linear correlation between attempts and goals scored, a look at this statistic supports the view of this tournament as a defensive one.
The teams took 26.4 shots per game (in 2012, the number was 26.5). Considering the matches' average effective play time, which was 57 minutes and 7 seconds, there were 2.16 shots per minute while the ball was in play. There were 2.19 per minute at Euro 2012 and 2.17 per second at the 2014 World Cup. This sheds a different light on statements regarding a defensive tournament.
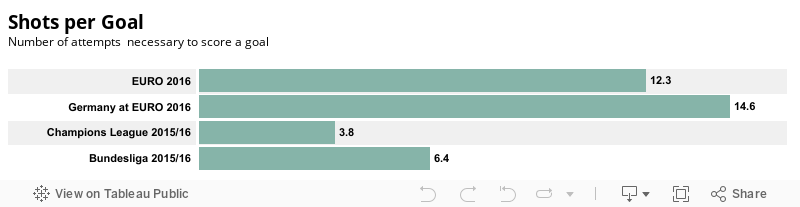
For this tournament the low accuracy of goal shots was discussed. This can be proven further shown by putting the stats it in comparison with those from other tournaments at the club level. While there are differences in how "an attempt" is defined, the following data clearly underscore the trend of a higher quality of club-level soccer in this area. In the Bundesliga, for example, only 6.4 shots on goal are needed to score a goal. In the Euro tournament, twice as many were needed.
3. Successful Styles of Play at UEFA Euro 2016
To accuse forwards of too-poor quality or to discuss the role of the striker in general (false nine vs. proper nine) is too narrow a scope. The teams' style of play and the tactics for keeping control of the ball have to be considered.
The duration during which a team has control of the ball before a goal was scored averaged close to 12.5 seconds. In comparison, at the 2010 World Cup, it was 15 seconds.
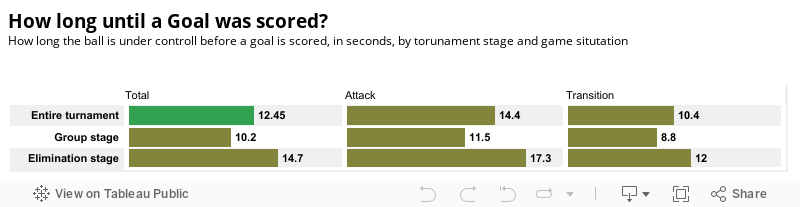
This number supports expert opinion that the speed of play has to be high to overcome the defensive team and achieve success. Moreover, this is supported by the fact that even a classic counter-attack, reaching from the defensive third to the opposing box, is hard to pull off in under 11 seconds at this level. On the other hand, this means that a team needs about 13 seconds to structure the defensive line.
It is clear that both tactical means were used in the group stage for a considerably shorter time interval. This supports the hypothesis of higher velocity in decisive actions. The successful phases became longer as of the round of 16.
Among other reasons, this may be related to the fact that in the group stage about a third of the goals resulted from an offensive phase, in which the scoring team lost the ball briefly in the field of the opposing team (either to the opposing team or in a phase in which neither team was in control of the ball), but regained control and was able to finish within four to five seconds.
This short interruption opens space and the ball can be passed into the box in a way which was previously impossible due to timing and distance. In the elimination stage there were remarkably fewer of these disruptions. This lengthened the average time of a phase of ball control. The longer duration of transition plays can be explained by the fact that there was a smaller number of classical counter-attacks against a small number of defenders, or no defenders at all. One more pass was usually needed to shoot at the goal.
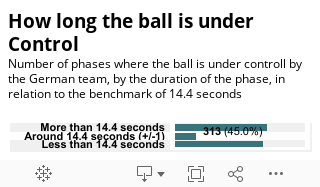
An analysis of all phases of ball control of the German team looks as follows: Germany had control of the ball 695 times. In 62.5% of these phases, Germany played against a structured defensive line. Only 10% of the situations which were transition plays resulted in attempted shots. This is testament to the problems of precise adjustment at maximum speed. At the 2014 World Cup, this was clearly achieved better.
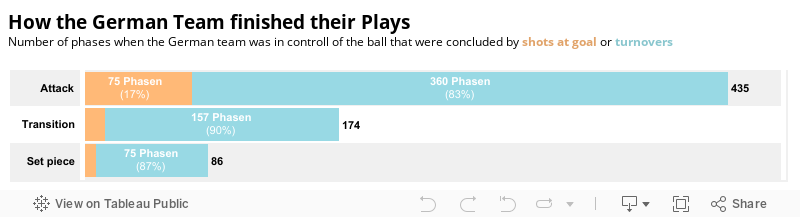
During offensive phases and transition play, Germany was in the benchmark area of scoring a goal in 12% of cases at Euro 2016. Short and fast phases aren't always suitable. Experts have to do qualitative analysis of single situations in the game. But a clear trend shows that Germany could profit from more speed.
The Upshot
Data analysis of the tournament shows a couple of astonishing trends that aren't obvious in a general and sometimes superficial presentation of the tournament. Portugal displayed successful defensive tactics, which shows interesting developments in European soccer. Whether these trends and developments will continue will be seen at the 2018 World Cup. We believe that this additional data and the deeper analysis thereof makes the game even more fascinating.
Got a sports viz of your own to share? Tweet it to us @tableaupublic.
관련 스토리

Meet Iron Viz 2024 Finalist Jessica Moon
 2024/04/15

Meet Iron Viz 2024 Finalist Pata Gogová
2024/04/08

Student to BI Analyst, How Tableau Can Lead to a Successful Data Career
 2024/03/20
Subscribe to our blog
받은 편지함에서 최신 Tableau 업데이트를 받으십시오.