84 Iron Viz entries visualize migration data from The Associated Press


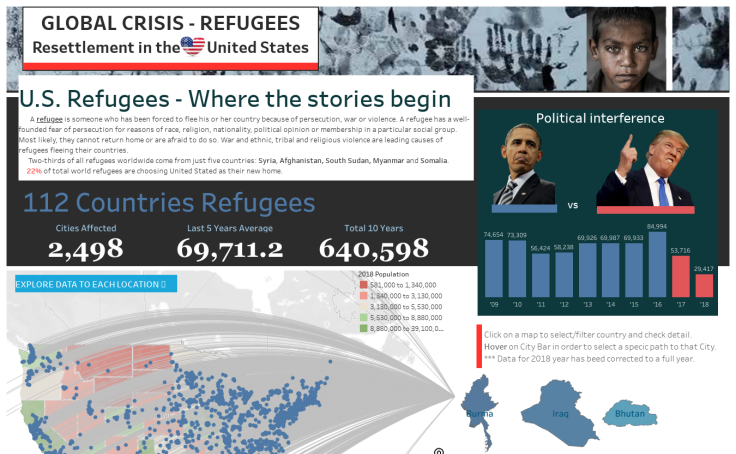
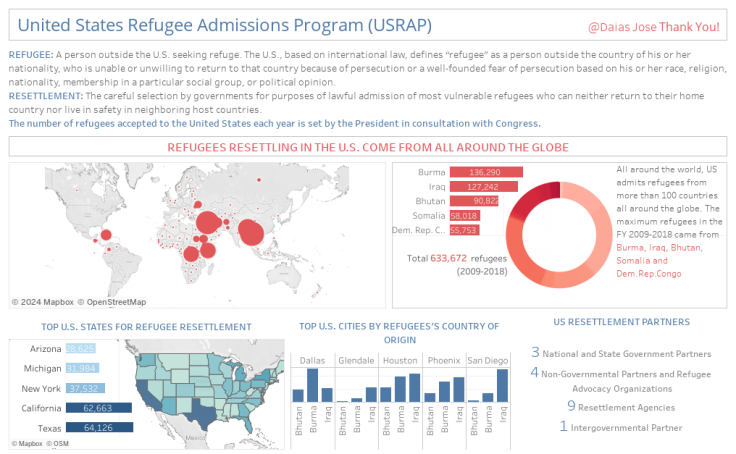
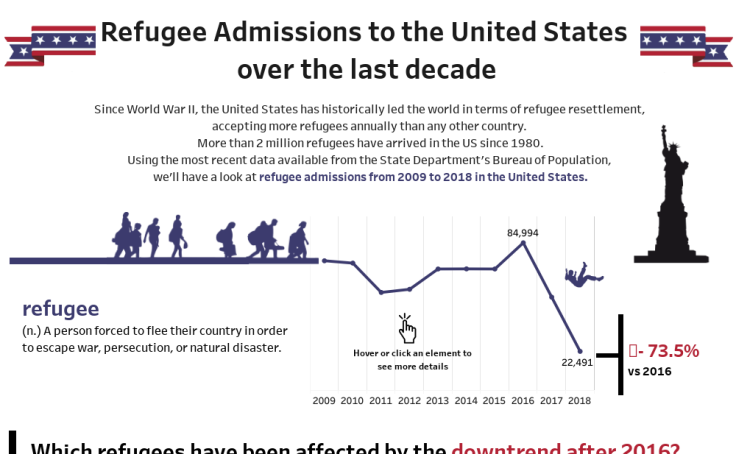
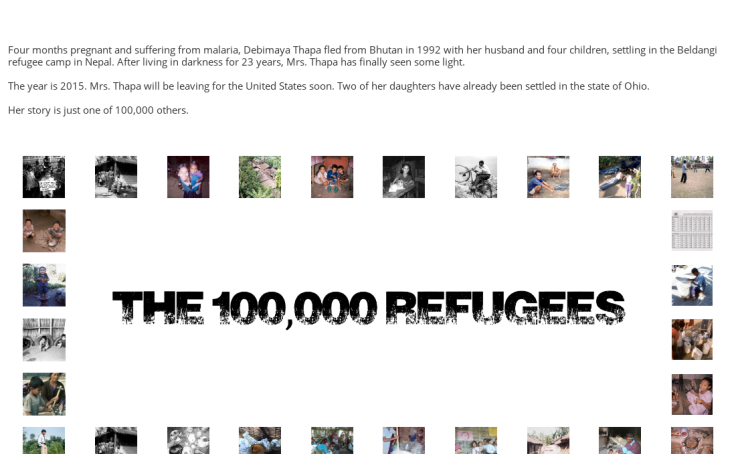
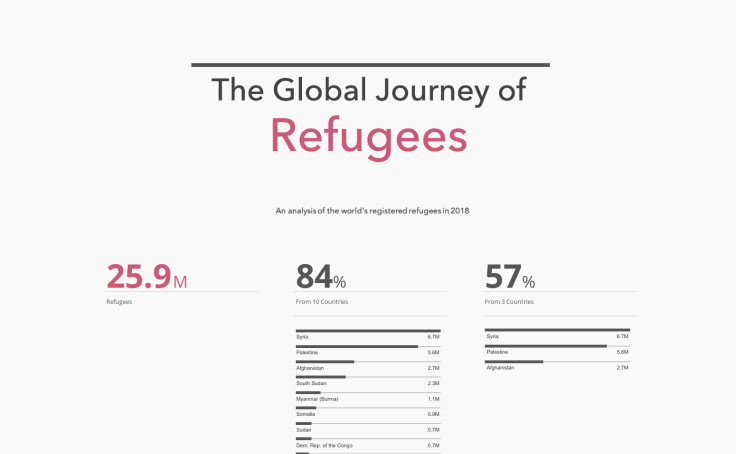
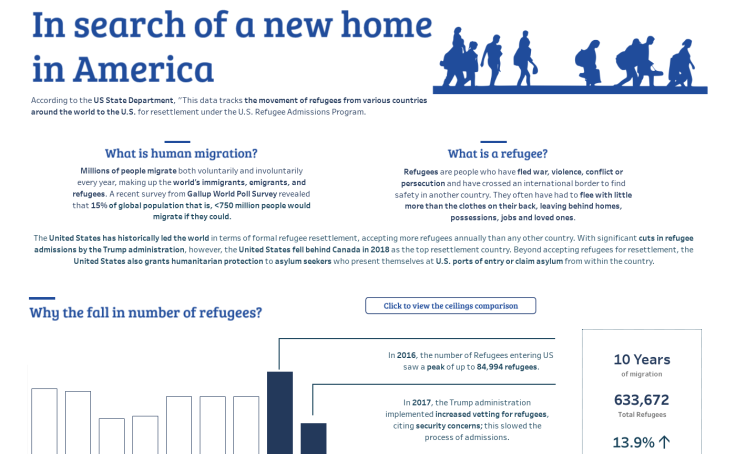
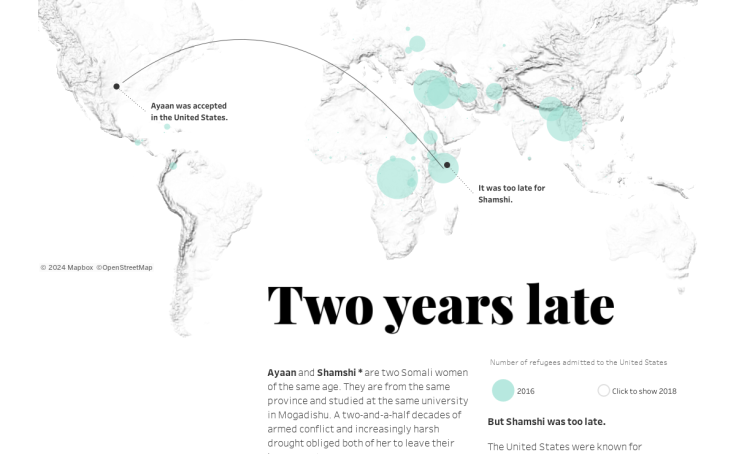
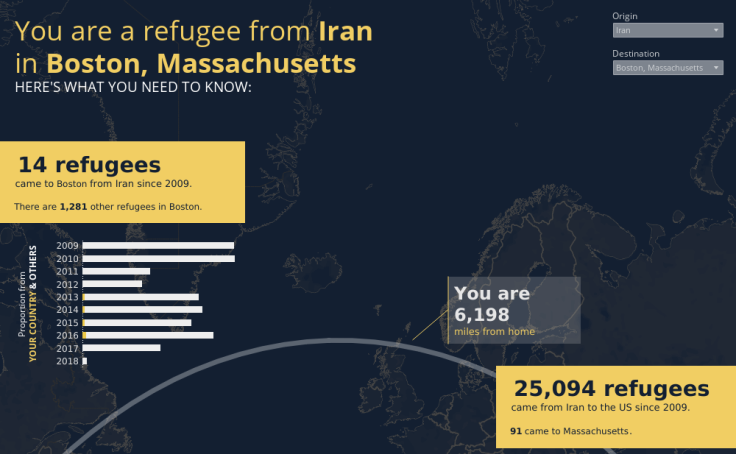
Entries to the third 2019 Iron Viz global qualifier contest on migration data are officially in! For this contest, we challenged you to visualize data provided by The Associated Press on refugee admission to the United States. We received 84 entries and 54% of the entries were from first-time Iron Viz participants!
The winner of this contest will join our two finalists Joshua Smith and Lindsey Poulter on the Iron Viz stage at Tableau Conference (#data19) in Las Vegas. Heading to conference? Don’t miss this epic data visualization showdown to determine who will be the Iron Viz Champion!
Our judges will review the submissions and score them according to three criteria:
- Design: How appropriate is the design for the story that is being told?
- Storytelling: Is there a clear story being told or question being explored, and is there appropriate context?
- Analysis: How sophisticated and appropriate is the data that is being used for the story?
Only one will advance to the Iron Viz Championship, but all participants should be extremely proud of their work! Win or learn—you can’t lose. Impressed by the entries? Show your support by favoriting the vizzes below and following each author’s Tableau Public profile!


The conclusion of this contest marks the end of the 2019 Iron Viz qualifiers! Since the first Iron Viz competition in 2011, we’ve received over 1,000 stunning data visualizations. Take a look at some of them below:
- Explore this year’s entries to the Agriculture and Music qualifier contests
- Search #IronViz on Tableau Public to find over 175 Iron Viz entries
- Visit the Iron Viz Gallery to see which vizzes have reigned supreme in past years
관련 스토리

Meet Iron Viz 2024 Finalist Jessica Moon
 2024/04/15

Meet Iron Viz 2024 Finalist Pata Gogová
2024/04/08

Student to BI Analyst, How Tableau Can Lead to a Successful Data Career
 2024/03/20
Subscribe to our blog
받은 편지함에서 최신 Tableau 업데이트를 받으십시오.