The Chronicles of the Red Devils: The highlight, the filter, and the URL action


Editor's Note: This is a guest post by Shweta Savale, Co-founder & Head of Client Engagement at Syvylyze Analytics LLP
Interactivity is to a visualization what visualization is to a crosstab. It is the intuitive next step, the obvious outcome. Don’t you just love the way Tony Stark in Ironman is able to simply talk and wave his arms around to interact with his computer Jarvis… that is the power of interactivity. To go beyond just representing data as pretty pictures and be able to capture that inherent human impulse to reach out and touch the visual, interact with it, ask questions, explore scenarios. Interactivity drives a higher level of engagement and involvement, it has the ability to immerse and engross the user.
But while incorporating interactivity into our vizzes is easy with Tableau, the ability to introduce the simplicity of making interactions intuitive, needs great clarity of thought. Interactivity is based on a logical flow of thought that is an extension to the flow of the dashboard itself. One of the many ways to achieve interactivity in Tableau is through Actions.
Interactivity through Actions allow the designer of a viz to introduce an additional view or perspective of information. Consequently, a series of actions introduced into the logical flow of the dashboard, allows the user to peel away layer after layer of information and arrive at pertinent insights that answer specific questions.
If applied correctly, these Actions can help the end user to interact with the visualizations and gain additional information when relevant. The good part about Actions is that they can be applied across worksheets, within dashboards, across dashboards as well as across data sources thus giving users an ability to drill into the details at various levels. In Tableau, there are 3 types of Actions and they are as follows:
- Filter actions
- Highlight actions
- URL actions
In the following viz, I have included all the 3 actions mentioned above. With this viz, I wanted to tell the story of Manchester United Football Club’s performance over recent years.
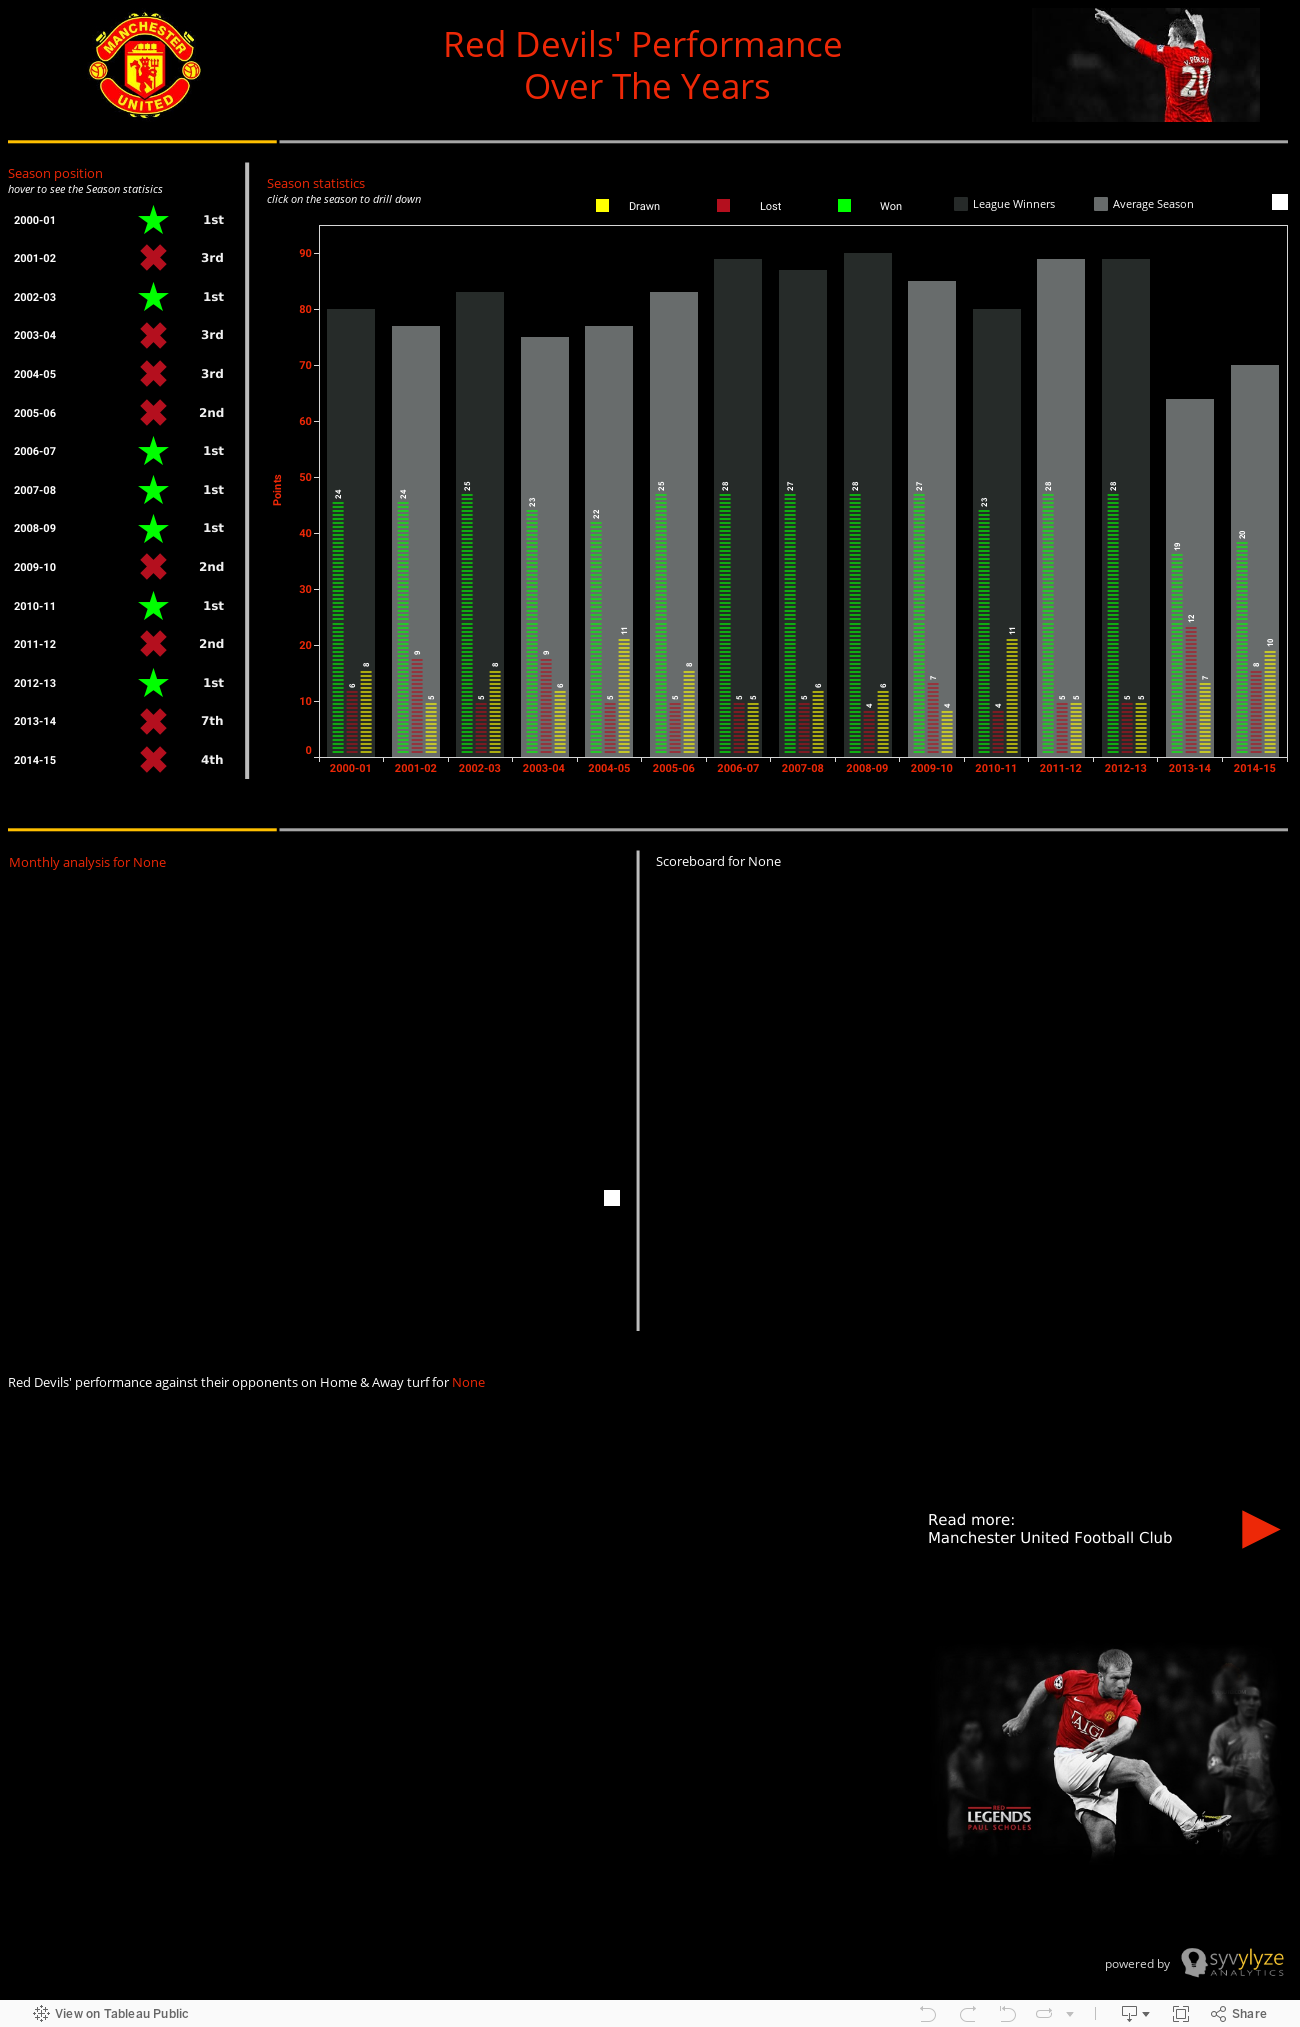
The first action used is the Highlight action which will run when we hover over any season in the list on the left-hand side titled Season position. When we do that, we will see that particular season getting highlighted in the chart titled Season statistics. The Season statistics chart, will give us details of the highlighted season in terms of the points scored by ManU, number of matches they won, number of matches they lost, and number of matches that were draws.
To set up this kind of action, start by selecting the Actions… option from the Dashboard menu. Then click on Add Action> and choose Highlight…. In the dialogue box we have to specify the respective source and target sheets of the action. Here, the list on the left of the viz is the source and the bar charts on the right-hand side of the dashboard are the target. Once we select our Source and Target sheets, we can specify how we want to run our action. We can choose from the following options.
- Hover: This will enable the action by simply hovering over a mark in the view.
- Select: One will have to click on a mark in the view to run the action.
- Menu: Here one has to right click and follow a link in the context menu.
Here we have chosen to run the action on hover - a common choice for highlight actions, as it neatly makes links between separate charts in a dashboard visible.

Adding a Highlight Action
Now, in order to be able to drill-down further into the ManU data in our viz, we would like the user to be able to look into the monthly analysis of specific seasons, and look at the opponent-wise score card of that season, and also view Manchester’s performance against their opponents on Home, as well as on Away turf, for the selected season.
For that objective a filter action was set up. When we click on the bars relating to a particular season from the Season chart, we will see that the blank areas at the bottom of the dashboard get updated to give us the desired information. Further, the minute we clear the filter selection on the Season Statistics chart, by clicking a second time, we will see that the sheets go blank again. This is because the Filter action has been set to Exclude all values on clearing the selection.
To add a filter action like this, we will have to go to the Dashboard menu and select Action…. . Then click the Add Action> button and chose Filter… . We chose the source and target sheets in the same way we did with the highlight action. Here, however, we set the action to run on a click, that is when a data point is selected in the chart. (Note, we could tick the check box to run the action on single select only, if we don’t want to give the user the option to select several marks at the same time.) Run on select is a common choice for filter actions.
Further, with filter actions, we can also specify what clearing the filter selection will do. There are 3 options available:
- Leave the filter: This will leave the filter on the target sheets as they are. Even after the filter is cleared, the target sheets will still show the filtered results from the last selection of the user.
- Show all values: Once the filter is cleared, this option will restore the original view of the target sheets by including all data points.
- Exclude all values: Once the filter is cleared, this option will clear the complete view of the target sheets by excluding all values. These cleared sheets will only be visible when we select another mark from the source sheet. This is the option that was chosen for the ManU viz.

Adding a Filter Action
Lastly, an URL action has been added to the viz. Note the sheet that sits in the bottom right-hand corner of the viz and simply shows a line of text, namely, “Read more: Manchester United Football Club”. When we click on the text, the URL action will take us to the official web page of the Manchester United Football Club. (In case you are wondering how this sheet was made, this is essentially a table that displays a string variable containing the above text, and has the marks style set to “shapes”, with the shape being the right-pointing triangle.)
To set up the URL action for it, we start just like with the other two types of actions, by going into the Dashboard menu and selecting Action…. Then we click the Add action> button and chose URL action. In the dialogue box we select the source sheet from where this action should run – in this case the sheet with the instruction text. We then put the URL of the webpage that we want to refer to into the URL box.

Adding a URL Action
As you can see, it takes just a few clicks to add these different types of actions, but it makes the viz a lot richer. Designing a dashboard is like building a storyline, it has a theme, a flow and a goal. Actions allow you to elaborate on the storyline, sort of like a pop-up book. Applied judiciously in the right place and at the right time, it can makes the story you are telling, come alive! If you are a ManU fan, we hope you will enjoy following that story arch in the viz above. But if you support a different team, why not create your own interactive viz?
相关故事

Meet Iron Viz 2024 Finalist Jessica Moon
 2024/04/15

Meet Iron Viz 2024 Finalist Pata Gogová
2024/04/08

Student to BI Analyst, How Tableau Can Lead to a Successful Data Career
 2024/03/20
Subscribe to our blog
在您的收件箱中获取最新的 Tableau 更新。